

Data Engineering · Strategy · 18 min
Data Engineering for Growing Businesses: From Disconnected Data to Reliable Decisions
Why more data often produces less clarity—and how a reliable path from source systems to business information fixes it.

Direct answer
What is data engineering for a growing business?
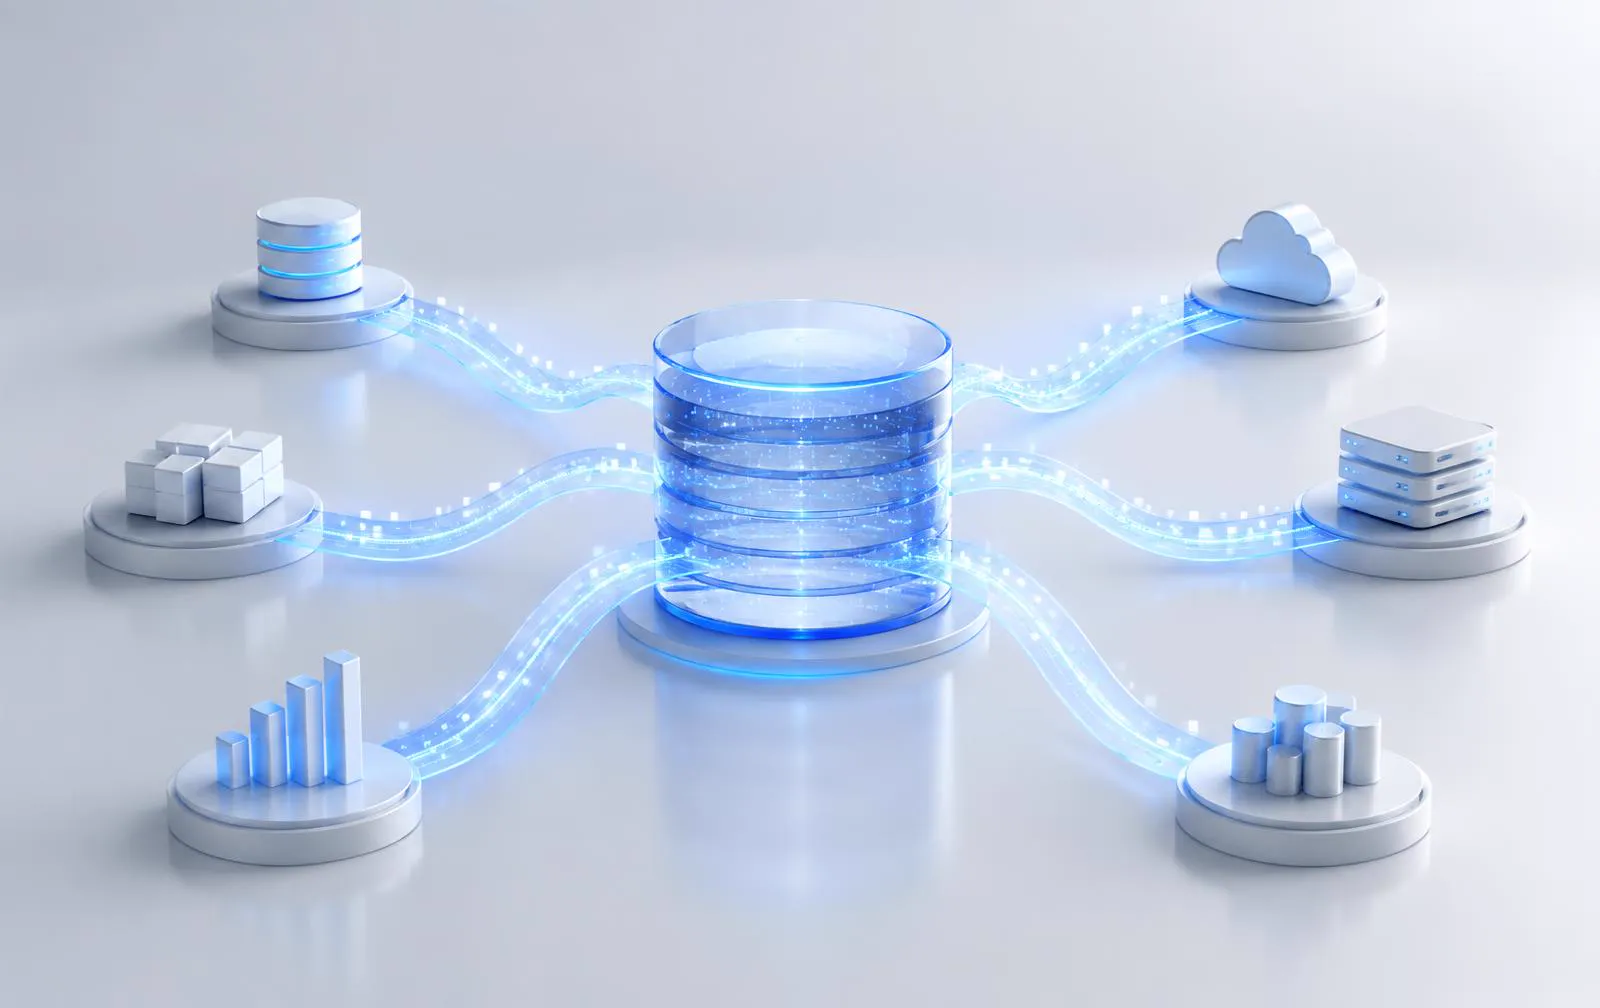
Data engineering turns data scattered across operational systems into dependable information that applications, reporting and analytics can use consistently. It typically involves ingestion, transformation, storage, validation, modelling and monitoring. The objective is not simply to move data into one place. It is to create a reliable path from source systems to trustworthy business information—so that the same question asked twice returns the same answer, and people can explain where that answer came from.
Key takeaways
- Data centralization alone does not create trustworthy information.
- Reliable reporting depends on reliable pipelines.
- Transformation logic should be controlled and testable.
- Data ownership matters as much as technology.
- Not every business needs a large data platform immediately.
- Architecture should evolve with actual decision and reporting requirements.
Why do businesses have more data but less clarity?
Because each new system creates its own version of the business. Growth adds CRM records, ERP transactions, finance ledgers, operational apps and spreadsheets—but nothing automatically reconciles them into one dependable view.
A company with twenty people often runs on one accounting package and a shared spreadsheet. At two hundred people it may have a CRM for sales, an ERP for orders and inventory, a separate finance system, an operational application for field or warehouse work, a support tool, several external platforms supplying marketing or payment data, and dozens of spreadsheets that fill the gaps between them. Each system is reasonable on its own. Together they produce several partial truths.
The symptoms are familiar. Sales reports one revenue figure and finance another. A customer exists three times with slightly different names. Operations counts an order as complete when it ships; finance counts it when it is invoiced. Management reporting depends on one analyst who knows which export to trust, which column to fix and which rows to remove. When that person is on leave, the monthly pack is late.
None of this is caused by a lack of data. It is caused by the absence of a controlled path between where information is created and where decisions are made. That path is what data engineering builds.
- CRM: leads, opportunities, accounts and contacts
- ERP: orders, items, inventory and fulfilment
- Finance: invoices, payments, ledgers and cost centres
- Operational applications: jobs, tasks, shipments, service events
- Spreadsheets: planning, adjustments and local master lists
- External platforms: marketing, payments, marketplaces, partners
- Separate databases behind older or bespoke applications
- 01SourceWhere does the information originate?
- 02IngestHow does it enter the platform?
- 03TransformHow is it standardized and combined?
- 04ValidateHow do we know it is correct?
- 05ModelHow is it structured for business use?
- 06ServeWhere is it consumed?
- 07ObserveHow do we know the pipeline continues to work?
A failure anywhere in the chain weakens trust at the end.
What does data engineering actually do?
It builds and operates the path that takes data from source systems to the people and applications that depend on it—so the information arrives on time, in a consistent shape, and with evidence that it is correct.
Ingestion: getting data out of the systems that create it
Business requirement: reporting should not depend on someone exporting a file. Ingestion extracts data from applications, databases, files and APIs on a schedule or as events occur, and lands it somewhere controlled. The design question is not only how, but how often—daily may be enough for board reporting, while stock or dispatch visibility may need minutes.
Transformation: making data from different systems comparable
Business requirement: a customer, product or region should mean the same thing everywhere. Transformation standardizes formats, maps codes between systems, removes duplicates, applies business rules and combines sources. This is where most of the real business knowledge lives, which is why it needs to be written down in code rather than in someone's memory.
Storage: keeping current and historical data in one governed place
Business requirement: answer questions that span systems and time. Operational systems are optimized for running transactions, not for comparing last quarter with this one across four sources. A warehouse or analytical store holds history in a form designed for that analysis.
Validation: proving the numbers before people rely on them
Business requirement: leaders should not discover data problems in a meeting. Validation checks counts, uniqueness, completeness, allowed values and reconciliation to source totals before data is published.
Modelling: shaping data around how the business thinks
Business requirement: people should find 'revenue by customer by month' without understanding forty source tables. Models translate technical structures into business entities, measures and definitions.
Orchestration and monitoring: keeping it working every day
Business requirement: the report that worked yesterday must work tomorrow. Orchestration runs steps in the right order with the right dependencies; monitoring detects failures, delays and unusual results before users do.
The Data Reliability Chain: where trust is gained or lost
Xyncwave's Data Reliability Chain treats the path from source to decision as seven linked stages. A failure anywhere in the chain weakens trust at the end.
The chain is deliberately simple. Its value is diagnostic: when a leader says 'I don't trust this dashboard', the useful response is to find which link failed, rather than rebuilding the dashboard.
Source — where does the information originate?
Name the system of record for each business entity. If two systems both believe they own the customer, no downstream work will fully resolve the disagreement.
Ingest — how does it enter the platform?
Establish method, frequency and completeness. A partial extract that silently drops late records creates errors that look like business changes.
Transform — how is it standardized and combined?
Make mappings and rules explicit, versioned and reviewable. Transformation hidden inside spreadsheets or report formulas cannot be tested.
Validate — how do we know it is correct?
Define checks that fail loudly: counts against source, key uniqueness, required fields, reconciliation of financial totals.
Model — how is it structured for business use?
Agree definitions once—active customer, net revenue, on-time delivery—and publish them in a shared model rather than re-deriving them in every report.
Serve — where is it consumed?
Reports, dashboards, applications, exports and increasingly AI tools. Each consumer should use the governed model, not a private copy.
Observe — how do we know it continues to work?
Monitor freshness, failures, volumes and test results. A pipeline without observation is correct only until the first unnoticed change.
Moving data is not the same as creating reliable data
Copying CRM and ERP tables into a warehouse centralizes the problems as well as the data. Transformation and validation are what turn a copy into dependable information.
A common first data project is to connect every source to a warehouse and point a BI tool at the result. It feels like progress because data is finally in one place. Within weeks the same arguments return, now with faster queries. The underlying disagreements were never in the transport; they were in the meaning.
| Problem that survives a simple copy | What it looks like | What resolves it |
|---|---|---|
| Duplicates | The same customer appears under three spellings across CRM and ERP | Matching rules and a master key in transformation |
| Conflicting definitions | Sales and finance calculate revenue differently | One agreed definition in a shared model |
| Missing values | Region or cost centre blank on a share of records | Required-field tests and a defined default or exception queue |
| Incorrect mappings | Product codes differ between systems | Maintained mapping tables with ownership |
| Inconsistent date formats and time zones | Orders appear on the wrong day or month | Standardization in staging models |
| Stale records | Yesterday's extract failed; today's report looks normal | Freshness checks and alerting |
| Business-rule conflicts | A cancelled order still counts as shipped | Explicit status logic, tested against known cases |
Data Reliability Maturity Model
A Xyncwave directional maturity framework—not an industry standard. It helps teams describe where they are today and what the next practical step is.
Most growing businesses do not need to reach Level 5 across every domain. Reaching Level 4 for the handful of decisions that drive the business is often the more valuable target.
Level 1 — Fragmented
Data remains inside systems and spreadsheets. Reporting is assembled manually and depends on individuals. Next step: identify the few reports that matter most and their sources.
Level 2 — Collected
Data is centralized but inconsistently prepared. Queries are faster, but definitions still vary by report. Next step: move business rules out of reports into shared transformation.
Level 3 — Structured
Transformation and models create standardized information. Most reports use shared definitions. Next step: add automated tests and clear ownership.
Level 4 — Trusted
Validation, testing and ownership improve reliability. Issues are caught before publication and there is a known person to resolve them. Next step: extend reliable data into operational workflows.
Level 5 — Operational
Data products and analytics reliably support ongoing business workflows—planning, pricing, allocation, customer communication—not only retrospective reporting.
ETL vs ELT: what is the difference?
ETL transforms data before loading it into the target store. ELT loads raw data first and transforms it inside the warehouse. Neither is universally better; the right choice depends on the platform, the data and the controls required.
Many real platforms mix both: light cleansing or masking during ingestion, with most business logic applied in the warehouse. The question to ask is not 'ETL or ELT?' but 'where should each rule live so it can be tested, changed and audited?'
ETL — Extract → Transform → Load
Transformation happens in a separate processing layer before data reaches the destination. It remains useful when data must be filtered or masked before storage, when the destination has limited processing capacity, or when heavy processing is better done in a dedicated engine.
ELT — Extract → Load → Transform
Raw data is landed first, then transformed using the warehouse's own compute—typically with SQL. Modern cloud warehouses that separate storage from compute make this pattern practical, and keeping raw data allows transformations to be re-run when rules change. The trade-off is that raw data, including sensitive fields, is stored in the platform and must be governed there.
When does a company need a data warehouse?
A warehouse becomes useful when important questions span several systems or long periods of history, and when manual consolidation has become a recurring cost or risk.
A warehouse may be unnecessary when one core system already holds most of the data and its built-in reporting answers the key questions, when volumes and source counts are small, or when the real problem is an unclear process rather than an analytical gap. In those cases a well-structured reporting layer on the core system, or fixing the upstream workflow, is the better investment. See how this connects to process work in Digital transformation starts with fragmentation.
- Several business systems contribute to the same decisions
- Cross-system reporting is required regularly, not occasionally
- Spreadsheet consolidation is repeated every week or month
- Reporting complexity is increasing faster than the team preparing it
- KPIs are inconsistent between departments
- Analytical requirements are growing—forecasting, segmentation, profitability
- Historical analysis is needed that source systems do not retain well
Data modelling: turning technical tables into business information
Raw operational tables are designed to run transactions, not to answer business questions. Modelling adds layers that progressively clean, combine and describe data in business terms.
Staging
A light layer that mirrors each source with consistent names, types and formats. No business logic yet—just a dependable starting point.
Transformed or intermediate layer
Where sources are joined, deduplicated and mapped: CRM accounts matched to ERP customers, product codes aligned, statuses standardized.
Business models
The layer people actually use: customers, orders, revenue, deliveries, with agreed definitions. Where it helps, these are organized as facts (events and measures such as order lines) and dimensions (descriptive context such as customer, product, date). The goal is clarity, not academic purity.
Semantic meaning
Documented definitions—what 'active customer' or 'net revenue' means, who owns the definition and when it last changed. Without this, two correct reports can still disagree.
Data validation is not optional
Validation turns 'we think the numbers are right' into evidence. It should run automatically every time data changes, and block publication when critical checks fail.
Tools such as dbt provide built-in tests for uniqueness, not-null, accepted values and relationships, and allow custom tests for business rules. The discipline matters more than the tool: decide which checks are critical, what happens when they fail and who is notified.
| Check | What it catches |
|---|---|
| Record counts | Missing or duplicated loads compared with the source |
| Uniqueness | Duplicate keys that inflate totals |
| Null checks | Missing required fields such as customer, date or amount |
| Accepted values | Unexpected statuses, currencies or categories |
| Reconciliation | Warehouse totals that no longer match finance or source systems |
| Transformation tests | Business rules that produce wrong results for known cases |
| Incremental-load verification | New or changed records that were skipped or loaded twice |
Data pipelines also fail operationally
Even correct logic fails when its surroundings change. Observability—knowing that a pipeline ran, on time, with plausible results—is what keeps reliability from decaying.
Observability means monitoring freshness (did data arrive when expected?), volume (is today's row count plausible?), test outcomes, run durations and failures—with alerts routed to someone who owns the fix. The aim is that the data team learns about a problem before the report consumer does.
- Source changes: a new field, a renamed status, a retired table
- Schema changes that break downstream joins
- API failures, rate limits and timeouts
- Duplicate inputs from retries or re-sent files
- Late-arriving data that misses the scheduled run
- Failed transformations after a logic change
- Expired credentials and permission changes
- Deployment errors that promote untested changes
What this looks like in practice
Xyncwave's published Snowflake + dbt analytics platform case study describes a pipeline built along this chain: Fivetran ingestion from source systems, Snowflake storage and processing, dbt transformation into analytical models, SQL validation, and changes promoted through Azure DevOps pull requests and controlled deployment workflows.
The case study documents the structure of the work—ingestion, warehouse storage, transformation, validation and deployment—not data volumes, adoption figures or financial outcomes. It is shown here as an example of the chain in a real delivery context, not as a benchmark.
A related healthcare data-processing case shows the same chain with different tools: rule-based transformation, orchestration and scalable processing used to standardize patient, account, facility and billing-related data.
What is the difference between data engineering and analytics?
Data engineering builds the reliable foundation. Analytics uses that foundation to answer business questions. Visualization is the presentation of those answers—not a substitute for either.
When organizations hire analysts before they have dependable data, analysts spend most of their time preparing data rather than analysing it. When they buy a BI tool first, dashboards expose inconsistencies faster but do not resolve them. The sequence matters: a modest, reliable foundation makes every later analytics investment more productive.
What should growing businesses build first?
Start from the decisions, not the data. Build the smallest reliable path that serves the most important reports, then expand domain by domain.
The next two articles in this series go deeper: which platform layers you actually need, and how to modernize a warehouse that already exists.
A practical sequence
Each step should produce something usable before the next begins.
- 1. Identify the important decisions and reports
- 2. Identify the source systems behind them
- 3. Agree definitions with the people who own them
- 4. Prioritize the highest-value datasets
- 5. Build initial ingestion for those sources
- 6. Transform and validate
- 7. Provide reliable consumption—reports, extracts or APIs
- 8. Expand iteratively to the next domain
Interactive planning tool
Data Platform Readiness Assessment
Ten quick questions about your current data environment. Your directional result appears immediately—no contact details required.
How many systems hold data your key reports depend on?
Buyer questions
Frequently asked questions
Evidence register
Research & Sources
- 01dbt Labs Documentation, 2026: What is dbt?
Official overview of dbt as a SQL-first transformation workflow with version control, testing and documentation. Accessed September 2026.
- 02dbt Labs Documentation, 2026: Add data tests to your DAG
Official reference for generic and singular data tests such as unique, not_null, accepted_values and relationships. Accessed September 2026.
- 03Snowflake Documentation, 2026: Key concepts and architecture
Official description of Snowflake's storage, compute (virtual warehouses) and cloud services layers. Accessed September 2026.
- 04Microsoft Learn, 2026: Introduction to Azure Data Factory
Official description of Azure Data Factory as a cloud data-integration and orchestration service. Accessed September 2026.
Start with the data path
Where does your data stop becoming dependable?
Map the source systems, transformations, reporting dependencies and validation gaps before deciding how much platform you actually need.
Review Your Data Environment